
Reason to trust
Strict editorial policy that focuses on accuracy, relevance, and impartiality
Created by industry experts and meticulously reviewed
The highest standards in reporting and publishing
Strict editorial policy that focuses on accuracy, relevance, and impartiality
Morbi pretium leo et nisl aliquam mollis. Quisque arcu lorem, ultricies quis pellentesque nec, ullamcorper eu odio.
The recent escalation in tensions between Israel and Iran has added a new wave of anxiety in the global markets, causing investors to adopt a more cautious stance towards investing. At the same time, Bitcoin’s technical chart is sending mixed signals that could lead to a breakout in either direction.
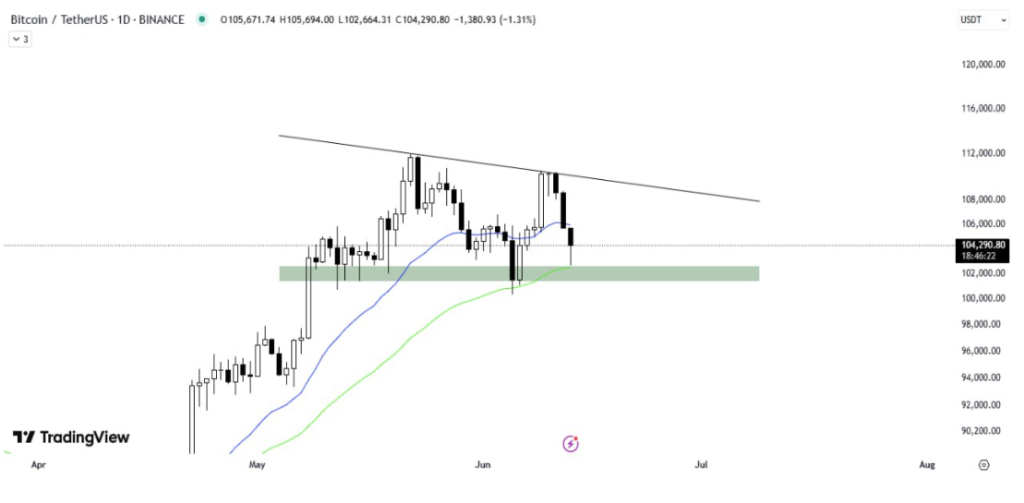
After a failed attempt to reclaim $110,000 earlier this week, the price has now slipped below the 21-day moving average, but still above support at the 50-day moving average. This confluence of moving averages, coupled with a clearly defined trendline resistance, has brought Bitcoin into a tightening price structure of a descending triangle pattern.
Related Reading
Descending Triangle With Tightening Range And Bearish Pressure
According to a crypto analyst on X, Bitcoin is forming a descending triangle pattern on the daily candlestick timeframe chart. Interestingly, technical analysis rules state that the descending triangle pattern setup is typically associated with bearish breakdowns. The chart image accompanying the post shows repeated rejection from a downward-sloping trendline that began when Bitcoin reached a new all-time high of $111,814 on May 22. The second rejection was a lower high around $110,000 earlier this week. On the other hand, the base of the triangle has remained constant with a support zone around $102,000.
The analyst noted that the 21-day moving average (21MA), shown in blue, is exerting downward pressure, acting as resistance, while the 50-day moving average (50MA), in green, is acting as a temporary support floor. As price action continues to narrow within this triangle move, the market is on the projection for a decisive move in any direction.
Whether it breaks above the resistance or falls through the support will likely dictate the next major trend. However, if the descending triangle pattern continues to play out with lower highs and steady support, the breakout will lean more towards a downside breakout.
Israel-Iran Tensions May Push Breakout Or Breakdown
The ongoing tensions between Israel and Iran could be the spark that forces Bitcoin out of its current range. Notably, a wave of liquidations hit the crypto market on Friday as reports of an Israeli airstrike on Iran made the news.
During periods of geopolitical instability like this, Bitcoin often trades in unpredictable ways. There are two possible outcomes for the leading cryptocurrency from here. It could act as a haven, or it could be sold off for liquidity. If the fear in traditional markets continues to increase, Bitcoin could break below the $102,000 support in the coming trading sessions, confirming the descending triangle’s bearish implications.
Related Reading
However, if bullish momentum returns, a break above the descending trendline could invalidate the bearish pattern and open the door for a retest of the $110,800 all-time high region. At the time of writing, Bitcoin is trading at $104,990.
Featured image from Shutterstock, chart from TradingView
#Bitcoin #Forms #Descending #Triangle #IsraelIran #Tensions